


What Can We Learn From VALD’s First WSL Football Report?

This article explores VALD's first ever Normative Data Report in the Women's Super League (WSL).
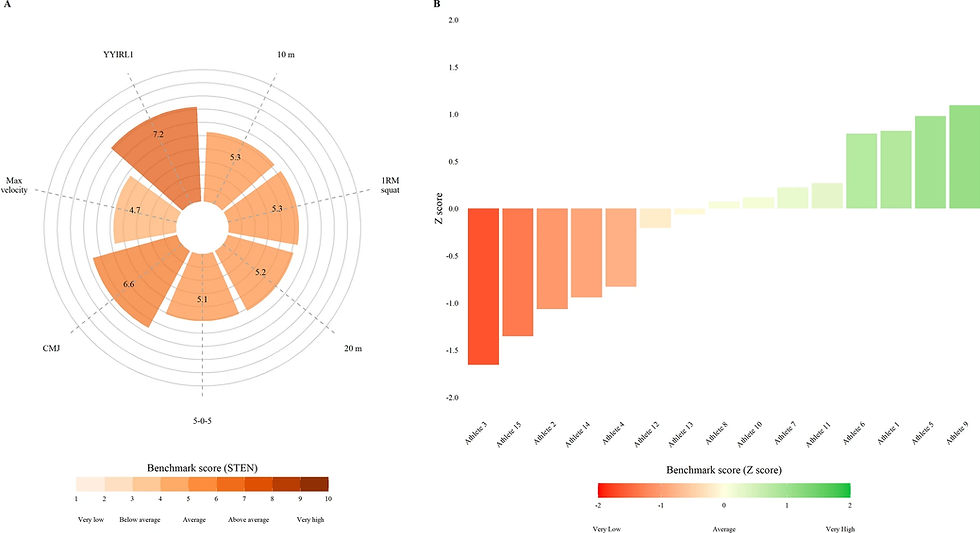
We know there is a sex data gap in sports science. At the same time, women's sports - and football in particular - has experienced rapid growth in recent times. Many projects are now focused on developed research and insights into physical profiling and athletic development in the women's game to try to fill that gap, such as the FIFA Female Health Project including our own benchmarking project.
This is what makes VALD’s first Women’s Super League Report particularly exciting. The report brings together more than 40,000 tests across over 180 test types, collected from youth and senior players within WSL clubs. It provides one of the most comprehensive female-specific football performance datasets currently available.
The report brings together more than 40,000 tests across over 180 test types
The scale of the dataset is impressive. However, the value of the report is not simply that it gives us more numbers. It is that those numbers can challenge how we interpret some familiar tests.
In this article, I have selected some key findings that stood out to me, alongside some important considerations for practitioners using the reference data.
The Growth Of Testing In The WSL
Before looking at individual physical qualities, the growth of testing within the league is worth recognising. The number of tests included in the dataset increased eleven-fold between the 2020/21 and 2025/26 seasons. Testing was also recorded on 91% of the available days during 2025/26, compared with 26% in 2020/21.
Although those figures do not tell us exactly how each club is using its data, they suggest that objective testing is becoming more embedded within the day-to-day work of women’s football. Testing appears to be moving beyond occasional profiling days and towards more regular monitoring across the season.
The number of tests included in the dataset increased eleven-fold between the 2020/21 and 2025/26 seasons
That matters because the real value of testing rarely comes from collecting one isolated score. It comes from building sufficient context to understand what is typical for a relevant population, what is normal for the individual athlete and how their profile changes over time.
The WSL report offers a stronger population-level reference point, but the practitioner still has to provide the rest of the context.
Normative Data Still Needs Context
This is an important caveat to establish before diving into the findings. The values in the report are useful references, but they are not universal standards that every player must achieve.
This is a real-world dataset rather than a controlled research study. The testing context, athlete status and reason for selecting each assessment may therefore vary and, in many cases, will be unknown.
We can see a possible example of this in the DynaMo knee-flexion and knee-extension results, where youth players recorded higher values than senior players. It would be tempting to interpret this as evidence that the youth players possessed greater knee strength.
However, the volume of these assessments at the senior level suggests they have been used more selectively with those players, perhaps during rehabilitation or targeted monitoring. If that was the case, the result may partly reflect who was tested and why, rather than a genuine difference between the wider youth and senior populations.
This is not a weakness unique to this report. It is a consideration whenever we work with aggregated real-world data. Before interpreting a benchmark, we should ask who contributed to it, when they were tested, why the test was selected and how closely that context resembles the athlete in front of us.
This is a real-world dataset rather than a controlled research study.
The Calf-Ankle Complex May Be An Important Developmental Quality
One of the clearest differences between youth and senior players was found in measures of ankle plantar-flexor capacity. At the median, senior players produced approximately 20% more force during seated ankle plantar flexion and around 21% more force during the seated isometric calf raise. These were among the largest youth-to-senior differences identified anywhere in the report.
This caught my attention because, as I have discussed previously in my video on the calf complex (below), this area contributes to so many of the actions that define football performance. That includes sprinting, accelerating, decelerating, changing direction and repeatedly producing force during running and jumping. The seated position also places greater emphasis on the soleus, which contributes significantly to supporting and propelling the body during running.
We cannot determine from this dataset why the senior players produced more force. The differences may reflect physical maturation, greater strength capacity, exposure to high-intensity football actions or simply more years of accumulated training. Because this is a cross-sectional comparison, we should not assume that progressing into senior football caused the difference.
Nevertheless, the size of the difference suggests that calf and ankle capacity may be a valuable quality to monitor as players progress from academy to senior football. It also prompts us to ask whether this area receives attention proportionate to its contribution to football performance and rehabilitation.
Comparing Nordic And Isometric Knee-Flexor Strength
Another interesting analysis in the report compares Nordic hamstring force on the NordBord with isometric knee-flexor force in the prone position.
If we consider the force-velocity relationship, the eccentric force an athlete can theoretically produce should be higher than their isometric force. Comparing these two tests can therefore add context that we do not gain by looking at the Nordic score alone.
The report highlights a group of athletes whose Iso Prone force was greater than their Nordic force. A lower-than-expected Nordic result could occur for several reasons, and the comparison itself does not tell us which explanation applies.
The athlete may not be executing the Nordic exercise effectively. There may be a ceiling effect, particularly when a lighter athlete can no longer generate greater force because the resistance is constrained by their body mass. In that situation, adding external load might be appropriate. Alternatively, the result could reflect limited eccentric knee-flexor strength and flag a capacity worth addressing within the athlete’s strength and conditioning programme.
This is a good example of why I like to interpret related measures together. A Nordic score may appear low, but the appropriate response depends on whether we are looking at a technical issue, a test constraint or a genuine physical limitation.
Total Impulse And The Ability To Express Force Quickly
The report also plots concentric impulse from the countermovement jump against concentric impulse at 100 milliseconds. This allows us to compare an athlete’s total force output across the concentric phase with their ability to express force quickly during the first 100 milliseconds.
I find concentric impulse at 100 milliseconds particularly interesting and have included it as one of the exploratory measures within my own countermovement jump analysis framework.

At the population level, the senior players generally shifted upwards on both axes. They tended to generate more total concentric impulse and more impulse within the first 100 milliseconds, although there was still notable overlap between the youth and senior groups.
That overlap is important. The figure is not providing a simple boundary between a youth and senior player, nor should it become another set of universal targets. Instead, it offers a way to profile two related but distinct qualities and consider how they may develop over time.
For practitioners working across an academy pathway, this may be a useful comparison to track as young athletes develop and hopefully transition into senior football. It can help us look beyond whether an athlete produces a high overall jump output and consider whether they can access that force quickly under tighter time constraints.
A 10% Asymmetry Does Not Always Mean The Same Thing
The report also includes reference data for asymmetry across different phases and metrics within the countermovement jump.

Asymmetry tended to be greater during unloading and braking, reduced as the athlete approached take-off in the concentric phase, and then increased again during landing. This is a common pattern and was also reflected in VALD’s Premier League report using data from the men’s game.
This reinforces an important point: asymmetry is dependent on what we measure and where in the movement we measure it.
As such, a 10% asymmetry could be relatively unusual for one metric but quite typical for another. Applying one universal threshold across every phase and variable therefore risks oversimplifying the athlete’s result.
The DSI Threshold Depends On The Test
If you have followed my athlete-testing series, you will probably know that I am a fan of the Dynamic Strength Index (DSI), despite its limitations.
However, questions have always remained around the relevance of specific DSI thresholds to different populations, including female athletes, who have historically been underrepresented within the research. In addition, we are also seeing growing interest in alternatives to the isometric mid-thigh pull, with both the isometric belt squat and isometric squat becoming increasingly popular.
That choice of isometric test matters. Removing grip as a potential limiting factor can change the maximum force value, which in turn changes the DSI. We therefore should not expect thresholds developed using an isometric mid-thigh pull to transfer directly to a belt squat or isometric squat.
The analysis in the WSL report clearly demonstrates this. The distribution of DSI scores among these female footballers shifted depending on whether the isometric input came from the belt squat, isometric squat or isometric mid-thigh pull.

For me, this is one of the most practically useful findings in the report. It reinforces that a ratio cannot be separated from the tests used to create it. If the denominator changes because we select a different assessment, our interpretation and any associated thresholds must change with it.
Final Thoughts
These are only some of the findings explored within the report. Morgan Williams and the team at VALD have also provided percentile values across a wide range of strength and jump assessments, alongside further comparisons that practitioners can explore within their own profiling, rehabilitation and return-to-play work.
As we keep saying, the continued growth of women’s football creates a clear need for more female-specific performance data. This first WSL report provides one of the most comprehensive real-world datasets currently available and represents a valuable step forwards.
However, I do not think its greatest contribution is a definitive set of targets. Its value is in helping us ask better questions.
Better female-specific data gives practitioners a more relevant starting point for these discussions. It does not remove the need for individual baselines, longitudinal monitoring, knowledge of the testing context or practitioner judgement.
VALD's 2025/26 Women's Super League (WSL) normative data report is available to download from the VALD Hub now!
Stay tuned for more insights on athlete testing in our series sponsored by VALD Performance. Subscribe to our blog to stay updated!

This article is support by VALD Performance. For more information, about their technology, visit their website.

Comments