
PhD Pinboard: Embedding Submaximal Fitness Testing into Team Sports
- Guest

- Jul 16, 2025
- 12 min read
This PhD Pinboard article by Tzlil Shushan explores how submaximal fitness tests (SMFTs) can be used to reliably and sensitively track athlete fitness in team sport environments, without the need for high testing burden or lab-based setups.

I am Tzlil Shushan, currently an Associate Lecturer in Sport & Exercise Science and Rehabilitation at the University of Wollongong. As part of my academic role, I am engaged in applied research and consultancy with sporting organisations and individual athletes.
I am particularly interested in athlete monitoring, performance programming, and evaluating strategies to enhance sport performance in real-world environments.
Why does this research matter?
Optimising performance and supporting wellbeing are goals we all share in our day-to-day work as practitioners in professional sport.
To support these goals, monitoring and exercise assessments have become embedded in daily practice. These can provide objective (and subjective) data that help guide decision-making and communication across the performance team such as training management, future training delivery, and the implementation of recovery or conditioning protocols.
In light of these needs, my PhD focused on exploring the utility of embedded and pragmatic monitoring approaches in team sports, using submaximal fitness tests (SMFTs) to better understand athlete responses and training effects.
The PhD Journey
During the early stages of my PhD, I was fortunate to be part of broader discussions, consult with experienced researchers and practitioners, which led to the formation of a research group, with each member contributing meaningfully to the projects I led during my candidature.
To begin, we aimed to provide a framework for SMFT in team sports, that can offer as a reference guide for researchers and practitioners in the field (1). We sought to present an operational definition for SMFT: a short exercise bout performed at a standardised, non-exhaustive intensity, designed to infer an athlete’s physiology through the monitoring of relevant outcome measures.
From this, we identified five distinct SMFT categories considering the structure of the exercise and the way intensity is prescribed (Figure 1).

The most commonly utilised were continuous fixed protocols, involving continuous exercise for 3 to 5 min at a predetermined submaximal intensity, and intermittent incremental protocols, which resemble shorter versions (~ 4 to 6 min) of maximal fitness tests such as the 30–15 Intermittent Fitness Test.
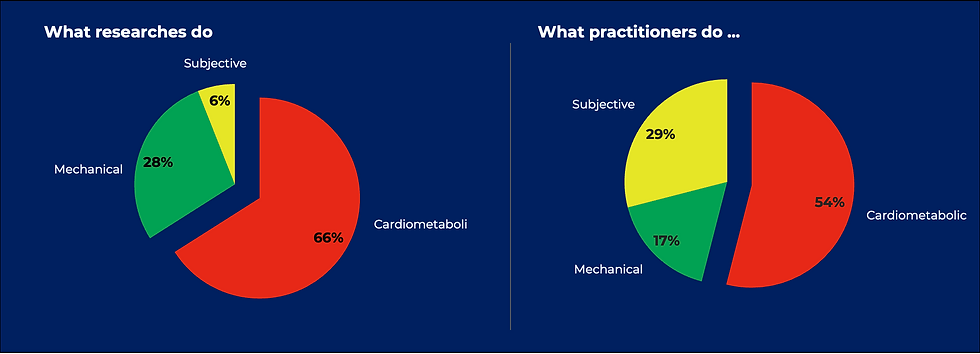
There are various outcome measures that can be collected during and following a SMFT falling into three response types: cardiometabolic, subjective, and mechanical.
These measures are typically used as proxy indicators of underlying physiological systems (either directly or indirectly), to assess an athlete’s physiological state or infer training effects.
Measurement properties are important
Understanding the measurement properties of SMFT’s protocols and outcome measures is a fundamental step in evaluating their validity, or how accurately they reflect the physiological construct they are intended to represent and reliability, or how consistently they can capture natural fluctuations (3).
With this knowledge, we can better determine their relevance as proxy measures of physiological systems and supports the interpretation of what constitutes a meaningful change.
With this in mind, my follow up studies (4,5) focused on gaining insights into outcome measures measurement properties in relation to protocol, athlete demographics, and analytical techniques.
At the time, there was already 10+ years’ worth of data on heart rate (HR) derived indices from SMFT (6), with exercise HR (HRex) being consistently applied. Therefore, one aim was to establish robust estimates of HRex reliability and validity.
Figure 3, panel A and B, shows a meta-analytics forest plot for HRex reliability and validity, respectively.

For reliability, the typical error (TE) was 1.6 % points (95% CIs: 1.4 to 1.9), with a 95% prediction interval suggesting that future studies may observe TE values between 0.9 and 3.0 % points.
Regarding validity, the pooled correlation coefficient between HRex and maximal fitness test performance was –0.58, with the 95% confidence interval (–0.54 to –0.62) indicating a large association.
These results confirm the high-degree of reliability for HRex and affirm its construct (convergent) validity as a proxy for cardiorespiratory fitness in team-sport athletes.
In figure 4 you can find practical considerations informed by the findings of the meta-analysis and regression for designing and monitoring SMFT HRex in team sports.

Same measures, many metrics.
Another emerging topic is the use of accelerometry data derived from microelectromechanical systems (MEMS). These outcome measures are monitored with the view to assess lower-limb neuromuscular status (fatigue and efficiency).
While still relatively novel, researchers have increasingly sought to explore different protocols (e.g., continuous vs. intermittent), technologies (e.g., MEMS units mounted between the scapulae vs. on the foot), and analytical approaches ‒ ranging from simple metrics to more complex modelling techniques.
In a follow-up study, we aimed to replicate these methodologies to minimise variability from differing cohorts, technologies, or protocols ‒ factors that often complicate between-study comparisons (5).
To provide an example of variations in analytical techniques, Figure 5 presents different approaches used to process raw accelerometer and GPS data from an intermittent fixed protocol for quantifying distinct phases of the run (i.e., acceleration, deceleration, and constant velocity phases).
Each method classifies these phases differently (e.g., thresholds of acceleration change, or model-based segmentation) and subsequently calculates the proportion of accelerometry-derived load based on the time spent in each phase. As a result, the interpretation of mechanical load depends not only on the raw data but also on how these movement phases are defined and processed.

The key findings of this study were:
HRex consistently demonstrated the highest level of reliability, with results unaffected by differences in exercise intensity or timing of data collection.
HR Recovery (HRR) showed improved reliability when collected after higher-intensity continuous protocols, compared to lower-intensity equivalents.
Foot-mounted MEMS-derived variables (predominantly contact time and flight time) showed superior reliability compared to scapula-mounted, with contact time consistently presenting the highest reliability among all measured variables.
Beyond validity and reliability: detecting meaningful changes
Sensitivity generally reflects how well an outcome measure can detect true physiological changes beyond its normal measurement error.
Yet, despite the importance in monitoring individual adaptation, most research at the time had focused on between-athlete comparisons, with limited attention given to how these measures perform within individuals over time.
To address this gap, an additional study (7) within my PhD designed to assess the sensitivity of HR measures derived from SMFT to detect within-athlete changes in cardiorespiratory fitness, in both under controlled laboratory and applied field conditions, and across different exercise intensities.
In our design, SMFTs were administered weekly in the field rather than relying solely on traditional pre- and post-testing. This repeated-measures approach reduces measurement noise and helps mitigate the impact of external factors that can influence isolated test outcomes. Changes in HR-derived indices were then evaluated in relation to each athlete’s overall trend across the training period.
Most players showed a decrease in SMFT HRex across the preseason (Figure 6), with a group mean reduction of 3.6 % points. However, notable variation was observed (SD = 5.8 % points), indicating that individual responses varied considerably.

These differences highlight the importance of understanding sensitivity not just as a statistical property, but as the link with changes (longitudinal validity) in the criterion or indicator associated with the construct of interest (physiological or performance).
The results showed that changes in HRex demonstrated very large correlations (r = –0.64 to –0.83) with changes in maximal aerobic speed (MAS), regardless of test setting or exercise intensity. In contrast, the relationship between changes in HRR and maximal fitness measures was stronger when HRR was collected in laboratory conditions and following higher-intensity SMFT protocols (Figure 7).

From Structured to Invisible Testing
A more ecologically valid approach for applying embedded testing involves using standardised (technically focused) training drills. This approach can further reduce the burden of structured protocols (e.g., continuous runs) by integrating monitoring directly into planned training activities.
As a final project (8), we explored this approach more deliberately by integrating monitoring into drills already embedded in the team’s training program.
In this study, HRex data were collected over 12 weeks from both a continuous fixed-intensity run (criterion protocol) and a football-specific Y-shaped passing drill (practical protocol).
We found that controlling HRex responses for variations in external load (in this study total and high-speed running distances) improved the agreement between the two protocols (Figure 8). The root mean square error (RMSE) between HRex values from the passing drill and the continuous run dropped from 2.4 to 1.6 % points. This value falls within the TE observed for HRex, indicating that the remaining difference is no greater than what would be expected from normal test–retest variability.
In practical terms, this means the passing drill, when appropriately adjusted, provides a valid alternative (at least as continuous fixed protocol) for monitoring HRex in applied settings.

Another novel finding from this study was the strong relationship between adjusted HRex from the passing drill and laboratory measures of cardiorespiratory fitness. Compared to raw HRex values from the drill, adjusted HRex showed large to very large correlations with both V̇O2 max and MAS which were comparable in magnitude to those observed for the continuous SMFT (Figure 9). In contrast, unadjusted HRex showed only moderate and less consistent relationships.

These results support the use of a standardised passing drill as a valid and practical option for assessing cardiorespiratory fitness in football, particularly when used within a SMFT framework.
Practical Applications and Final Thoughts
Across the various studies of my PhD, our goal was to make athlete monitoring more practical, embedded, and meaningful in team sport settings. Submaximal fitness tests can offer a low-fatigue, repeatable option for frequent monitoring, with HRex emerging as a reliable, valid, and sensitive marker of cardiorespiratory adaptation.
HRex typically shows a moderate-to-strong inverse correlation (r = ~–0.7) with aerobic performance measures V̇O2 max and measured or estimated MAS. A 5 % points reduction in HRex typically aligning with approximately a 1 km·h⁻¹ improvement in MAS. This likely reflects the cardiovascular component of adaptation, while other important attributes such as anaerobic capacity and neuromuscular performance remain uncaptured by HRex alone.
To complement this, accelerometry-derived measures, and potentially subjective outcomes, offer additional insights into mechanical efficiency and neuromuscular fatigue. By analysing movement profile during submaximal efforts, such as contact time or vertical loading, these measures can help infer fatigue and efficiency changes in other physiological systems, offering a broader picture of an athletes’ physiological state. While SMFT HRex can confidently track aerobic fitness trends, it should complement and not replace maximal tests when accurate benchmarks or precise prescription are needed.
Looking ahead, continued refinement of standardised drill-based protocols and enhanced modelling techniques will be will be important for enhancing the pragmatic utility of these monitoring strategies. Further, targeted research involving female athletes (9,10) is necessary, given their underrepresentation in the current SMFT research.
Frequently Asked Questions (FAQs)
Which is the most practical SMFT protocol for my athletes?
There’s no one-size-fits-all protocol and different formats may suit different phases of the season or contexts. Start by asking: What outcome am I interested in, and which physiological system does it reflect?
In most cases, standardising the external load (e.g., speed, duration) makes it easier to deliver the protocol to the whole team on the field. However, it will only be effective if the protocol is both practical and repeatable within your environment. This approach will allow you to monitor internal responses such as HR consistently.
What tools do I need to collect and analyse this data?
Start with low-cost, accessible options like ratings of perceived exertion (RPE) collected after a standardised SMFT. While simple, this requires careful education and consistent collection to be meaningful. Adding HR responses enables you to track cardiovascular responses such as HRex, providing more objective insight into internal responses. If you're aiming to explore pacing or adjust for external demands, GPS or accelerometry is required.
How can I ensure the quality and consistency of the data I collect?
Wherever possible, schedule your SMFT on the same day of the week and at a consistent time. Encourage athletes to follow similar pre-test routines such as maintaining usual diet, hydration. Monitor environmental conditions like ambient temperature. Use the same testing unit for each athlete to reduce inter-device variability. Inconsistencies can influence results, so attention to detail during setup and implementation is essential for collecting meaningful data.
How much of a change in HRex is meaningful and when should I act on it?
Changes of less than 3% are likely within the range of normal variability—below 2 ⅹ TE and should generally be considered noise. A change between 3 to 5 % points may reflect a true physiological changes, but its practical importance is uncertain; in these cases, it's advisable to retest and monitor the trend over time before making decisions. Changes greater than 5 % are more likely to reflect meaningful adaptations, and in those instances, training adjustments or recovery strategies may be warranted.
References
(1) Shushan, T., McLaren, S. J., Buchheit, M., Scott, T. J., Barrett, S., & Lovell, R. (2022). Submaximal fitness tests in team sports: a theoretical framework for evaluating physiological state. Sports Medicine, 52(11), 2605-2626.
(2) Shushan, T., Norris, D., McLaren, S. J., Buchheit, M., Scott, T. J., Barrett, S., ... & Lovell, R. (2023). A worldwide survey on the practices and perceptions of submaximal fitness tests in team sports. International journal of sports physiology and performance, 18(7), 765-779.
(3) Robertson, S., Kremer, P., Aisbett, B., Tran, J., & Cerin, E. (2017). Consensus on measurement properties and feasibility of performance tests for the exercise and sport sciences: a Delphi study. Sports medicine-open, 3, 1-10.
(4) Shushan, T., Lovell, R., Buchheit, M., Scott, T. J., Barrett, S., Norris, D., & McLaren, S. J. (2023). Submaximal fitness test in team sports: a systematic review and meta-analysis of exercise heart rate measurement properties. Sports Medicine-Open, 9(1), 21.
(5) Shushan, T., Lovell, R., McLaren, S. J., Barrett, S., Buchheit, M., Scott, T. J., & Norris, D. (2023). A methodological comparison of protocols and analytical techniques to assess the outcome measures of submaximal fitness tests. International Journal of Sports Physiology and Performance, 19(2), 142-154.
(6) Buchheit, M. (2014). Monitoring training status with HR measures: do all roads lead to Rome?. Frontiers in physiology, 5, 73.
(7) Shushan, T., Lovell, R., McLaren, S. J., Buchheit, M., Iacono, A. D., Arguedas-Soley, A., & Norris, D. (2024). Assessing criterion and longitudinal validity of submaximal heart rate indices as measures of cardiorespiratory fitness: A preliminary study in football. Journal of Science and Medicine in Sport, 27(8), 565-571.
(8) Shushan, T., Lovell, R., & McLaren, S. J. (2025). Passing the Test: A Standardised Passing Drill Provides a Valid Assessment of Cardiorespiratory Fitness in Senior Football Athletes.
(9) MacKenzie, L., Lovell, R., Atkinson, L., Naumovski, D., & Shushan, T. (2025). Validity and Sensitivity of a Submaximal Fitness Test for Assessing Cardiorespiratory Fitness and Response to Preseason Training Load in Female Football Players. International Journal of Sports Physiology and Performance, 20(4), 592-599.
(10) Compton, H. R., Lovell, R., Scott, D., Clubb, J., & Shushan, T. (2025). Benchmarking the Physical Performance Qualities in Women’s Football: A Systematic Review and Meta-Analysis Across the Performance Scale. https://osf.io/preprints/osf/th72c_v2
Want to feature your research on the PhD Pinboard?
The PhD Pinboard series is designed to showcase the incredible work being done through PhD research in sports science. Our aim is to translate this research into an engaging, accessible format for sports science practitioners—focusing on what your work means in practice.
We’d love to hear from you. Head to the contact page via the link below and start your message with ‘PhD Pinboard’. Please include a short summary (no more than 250 words) of your PhD research and a sentence or two on why you'd like to share it on the Global Performance Insights blog.


Comments